Remote Sensing INOE
About ABBA
- About ABBA
Assessment of the relationship between Biomass Burning typology and the Aerosol intensive optical properties from LIDAR measurements during smoke transport (ABBA)
PN-III-P2-2.1-PED-2019-1816
Implementation period: 02/11/2020-01/11/2022
Objective: To develop a methodology which quantifies the relationship between the biomass burning typology and the smoke measurements acquired by lidar in remote locations. Biomass burning typology (or smoke typology) will refer to the vegetation type (land cover).
The smoke measurements by lidar (observations) are quantified in terms of IOPs. The analysis will be based on the long timeseries (2008-2018) of lidar measurements at INOE (Magurele, Ilfov) and exiting state-of-the-art algorithms that INOE developed in the framework of the European infrastructure ACTRIS (Aerosol, Clouds and Trace Gases Research Infrastructure - https://www.actris.eu/). Additional synergetic information from satellites and model will be used to identify the fires (biomass burning source). Thus, in order to identify the smoke origin, we use the HYSPLIT (Hybrid Single-Particle Lagrangian Integrated Trajectory) model, which computes the backtrajectories of the air masses from a certain altitude at our location (based on meteorological field) and the fire database FIRMS (Fire Information for Resource Management System), which contains all the fires detected around the globe. After fires’ identification (in time and space), we extract the vegetation type in those locations. The fire radiative power (FRP) provided by FIRMS will be taken into account as well in order to assess the injection height and further assess the impact of transported biomass burning (BB) smoke in Magurele. The cluster analysis will be investigated in order to group the fires aiming to obtain homogeneous areas (clusters) from vegetation type point of view. The statistical tools will be employed to quantify the link between vegetation type and the lidar measurements (IOPs). We expect the results will bring insights about how different fires, based on the vegetation type, affect Magurele site. Thus, the algorithm will provide more information on smoke category, being able to identify BB more specifically (e.g., grass BB or forest BB).
Estimated results:
- Report on assessment of the lidar data and land cover data over 2008-2018,
- Report on assessment of the relationships between the BB typology and intensive parameters as retrieved from lidar measurements;
- Report on dissemination and communication (workshops, conferences, 1 article journal high IF)
Summary 2020-2021
The goal of the project is to develop a methodology to quantify the relationship between biomass burning typology (smoke typology) and smoke measurements by lidar in remote locations. The typology of the biomass burning is assessed based on land cover (vegetation) type. Lidar measurements at INOE 2000 (Magurele, Ilfov) are materialized in intensive optical parameters (IOPs). In order to determine the IOPs, first we determine the profiles of the extensive optical properties of the particles (particle extinction and backscatter coefficients and particle linear depolarization ratio).
First stage (2020) – Lidar data assessment over 2008-2018
We have analysed the extended period of 2008-2020 and we found 108 complete measurements (three backscatter coefficients at 355nm, 532nm and 1064nm, two extinction coefficients at 355nm and 532nm and particle depolarization ratio at 532 nm). After quality control of the lidar data and other criteria to identify the smoke’s sources, six datasets (representing 11 smoke layers) from 2014, 2016 and 2017 were selected for further analysis. Due to the large uncertainty, the depolarization values were dismissed.
Second stage (2021) – Lidar data analysis, land cover and clusters analysis
We evaluated the pollution layers based on the backscatter coefficient at 355nm, using an algorithm developed in-house. For each pollution layer, we performed HYSPLIT backtrajectories (using clusters analysis). The ensemble backtrajectories was assessed considering at least 30 altitudes in the smoke layer (new approach). The mean backtrajectory was determined using Cluster analysis from HYSPLIT. Next, we identified the fires along the mean trajectory. For each fire, we estimated the injection height (to verify if the injection height reaches the air mass altitude) as well as the land cover type where the fire occurred.
We investigated the grouping of the fires on geographical regions using the cluster analysis. For each cluster we estimated the effective predominant vegetation type (EPVT). For ten geographical clusters, EPVT was either type II (grasses/cereals) – two cases, type IV (broadleaf crops) – seven cases or type V (savannah) – one case. The cluster with EPVT type V was located in West Russia. The clusters with EPVT type II were located in West and North-East Romania and West Ukraine. The clusters with EPVT type IV were located in South Romania and Ukraine (South, East, Central).
Scientific results presented at European Lidar Conference (2020 and 2021):
European Lidar Conference 2020, 18-20 November 2020, Granada, Spain (https://granada.congresoseci.com/elc2020/elc2020_scientific_program_v20201111):
1) S03P36: M. Adam, K. Fragkos, D. Nicolae, L. Belegante, D. Ene, V. Nicolae. „Biomass Burning Recorded By Lidar In Relationship With Vegetation Type”.
European Lidar Conference 2021, 16-18 November 2021, Granada, Spain
(https://granada-en.congresoseci.com/elc2021/elc2021_scientific_program_webversion! ):
2) S02P12: M. Adam, V. Nicolae, M. Boldeanu, „Algorithm to determine the aerosol pollution layers from ceilometer profiles”
3) S05P10: M. Adam, K. Fragkos, S. Solomos, L. Belegante, D. Ene, V. Nicolae, L. Janicka, V. Amiridis, “Updates on biomass burning in relationship with vegetation type”
Summary 2022
Third stage (2022) – Meteorological field investigation, analysis and quantification of the biomass burning typology versus intensive optical parameters
In addition to the new approach to determine the mean backtrajectory with HYSPLIT (considering an ensemble of at least 30 trajectories performed for each layer), we performed synergetic estimations using ERA5 reanalysis and FLEXPART. Thus, the trajectory of the air mass flow determined by the ERA5 reanalysis was in good agreement with HYSPLIT trajectories. FLEXPART analysis issued source-receptor maps which show the source regions contributing to the smoke layer. Except one, case the results showed good agreement with HYSPLIT and ERA5. In addition, FLEXPART provided the mass contribution in the layers from various sources. Thus, it was shown that the agricultural waste burning was the main source for all 11 smoke layers. The mass concentration was estimated also from the lidar extinction coefficient. The values are in good agreement with FLEXPART.
For the selected dataset, the mean travel time for the smoke was below three days.
We developed a new approach to characterize the typology of the biomass burning, based on the land cover type. Thus, for each fire we determined the predominant vegetation type (PVT) as the vegetation type with the largest contribution (in percentages). Taking into account that there are more sources (fires) which contribute to the measured smoke layer, we defined the effective predominant vegetation type (EPVT) as the PVT which contributes the most to the smoke particles emission.
For the 11 layers investigated, EPVT was either type II (grass/cereals) – two cases or type IV (broadleaf crops) – nine cases. Both types can be seen as agricultural crops. IPs values for the two types are similar. We expect different signatures for the other types once new data are acquired in the future. The methodology is applied to any type of vegetation. The travel time (corresponding to the fires which determined the EPVT) was between 0.31 days and 2.4 days. The EAE – CRLR correlation was in good agreement (within error bars) with the labelling of fresh versus aged smoke based on both EAE and CRLR values. The median of the travel time for fresh smoke was 1.65 days and for aged smoke was 2.4 days. Most of the fires analysed in our study were located in Ukraine which is one of the main sources for transported BB smoke at our location. LR355 and EAE tend to decrease with travel time while CRLR, BAE and CRBAE tend to increase with travel time (where the travel time is less than three days).
We investigated also the potential intrusion of the smoke within Planetary Boundary Layer (PBL). We analysed some parameters provided by solar/lunar photometer and the content of the black carbon (BC) estimated from aethalometer measurements. The photometer values for Angstrom exponent (AE) and fine mode fraction (FMF) show the presence of fine particles, which is a characteristic of smoke. The in-situ BC measurements available for four out of six lidar profiles show a possible PBL contamination from the smoke layers in the following 24h from the lidar measurements.
The dissemination of the current results was achieved by the participation to the 30th International Laser Radar Conference (ILRC) held online during June-July 2022, participation to the course „Earth Observation Products for Wildfires Monitoring and Forecast” (18-20 October 2022) and the publication of the results in Remote Sensing journal.
Scientific results 2022:
30th International Laser Radar Conference 2022
Scientific programme can be accessed here: https://meeting-info.org/ilrc-30-agenda/ (last access, 12/09/2022). The poster and the short abstract can be found here: https://meeting-info.org/ilrc-tuesday/ (last access 12/09/2022):
LIDAR MONITORING of BIOMASS BURNING SMOKE in CONNECTION with the LAND COVER, by
Mariana Adam, Konstantinos Fragkos, Stavros Solomos, Dragos Ene, Livio Belegante, Simona Andrei, Bogdan Antonescu, Victor Nicolae, Vassilis Amiridis.
Earth Observation Products for Wildfires Monitoring and Forecast
Scientific programme can be accessed here: https://training.eumetsat.int/course/view.php?id=462 (last access 17/10/2022). The poster session can be found here: https://padlet.com/TrainingEUMETSAT/gqfoms00iwf570fd (last access 17/10/2022).
„LIDAR MONITORING of BIOMASS BURNING SMOKE in CONNECTION with the LAND COVER”, by Mariana Adam, Konstantinos Fragkos, Stavros Solomos, Livio Belegante, Simona Andrei, Camelia Talianu, Luminita Marmureanu, Bogdan Antonescu, Dragos Ene, Victor Nicolae and Vassilis Amiridis.
Article published in Remote Sensing
Mariana Adam, Konstantinos Fragkos, Stavros Solomos, Livio Belegante, Simona Andrei, Camelia Talianu, Luminița Mărmureanu, Bogdan Antonescu, Dragos Ene, Victor Nicolae, and Vassilis Amiridis: Methodology for lidar monitoring of biomass burning smoke in connection with the land cover, Remote Sens. 2022, 14, 4734. https://doi.org/10.3390/rs14194734.
Figure 1 shows an example of lidar measurements where we identified two smoke layers, cantered around 1500 m a.g.l. and 2790 m a.g.l.
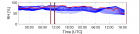
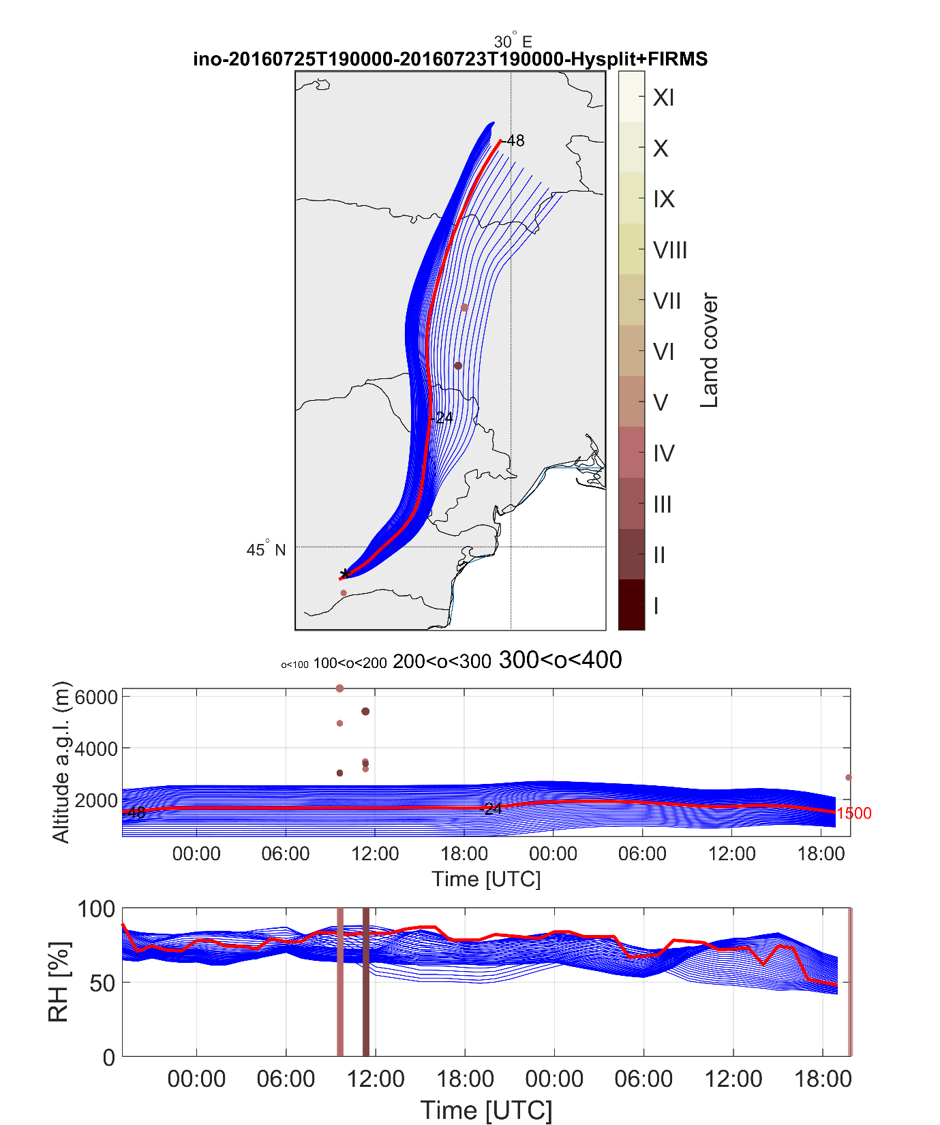
Figures 2-3 shows the HYSPLIT, ERA5 and FEXPART backtrajectories for the layers situated around 1500 m.
The lidar IPs for the two EPVT determined for all 11 smoke layers are shown in Figure 4. The results are shown also in Table 1. The corresponding plots representing the lidar profiles, HYSPLIT, ERA5 and FLEXPART trajectories are found in the Annex of the published article (https://www.mdpi.com/article/10.3390/rs14194734/s1).
For more details, please see the published article (https://doi.org/10.3390/rs14194734).
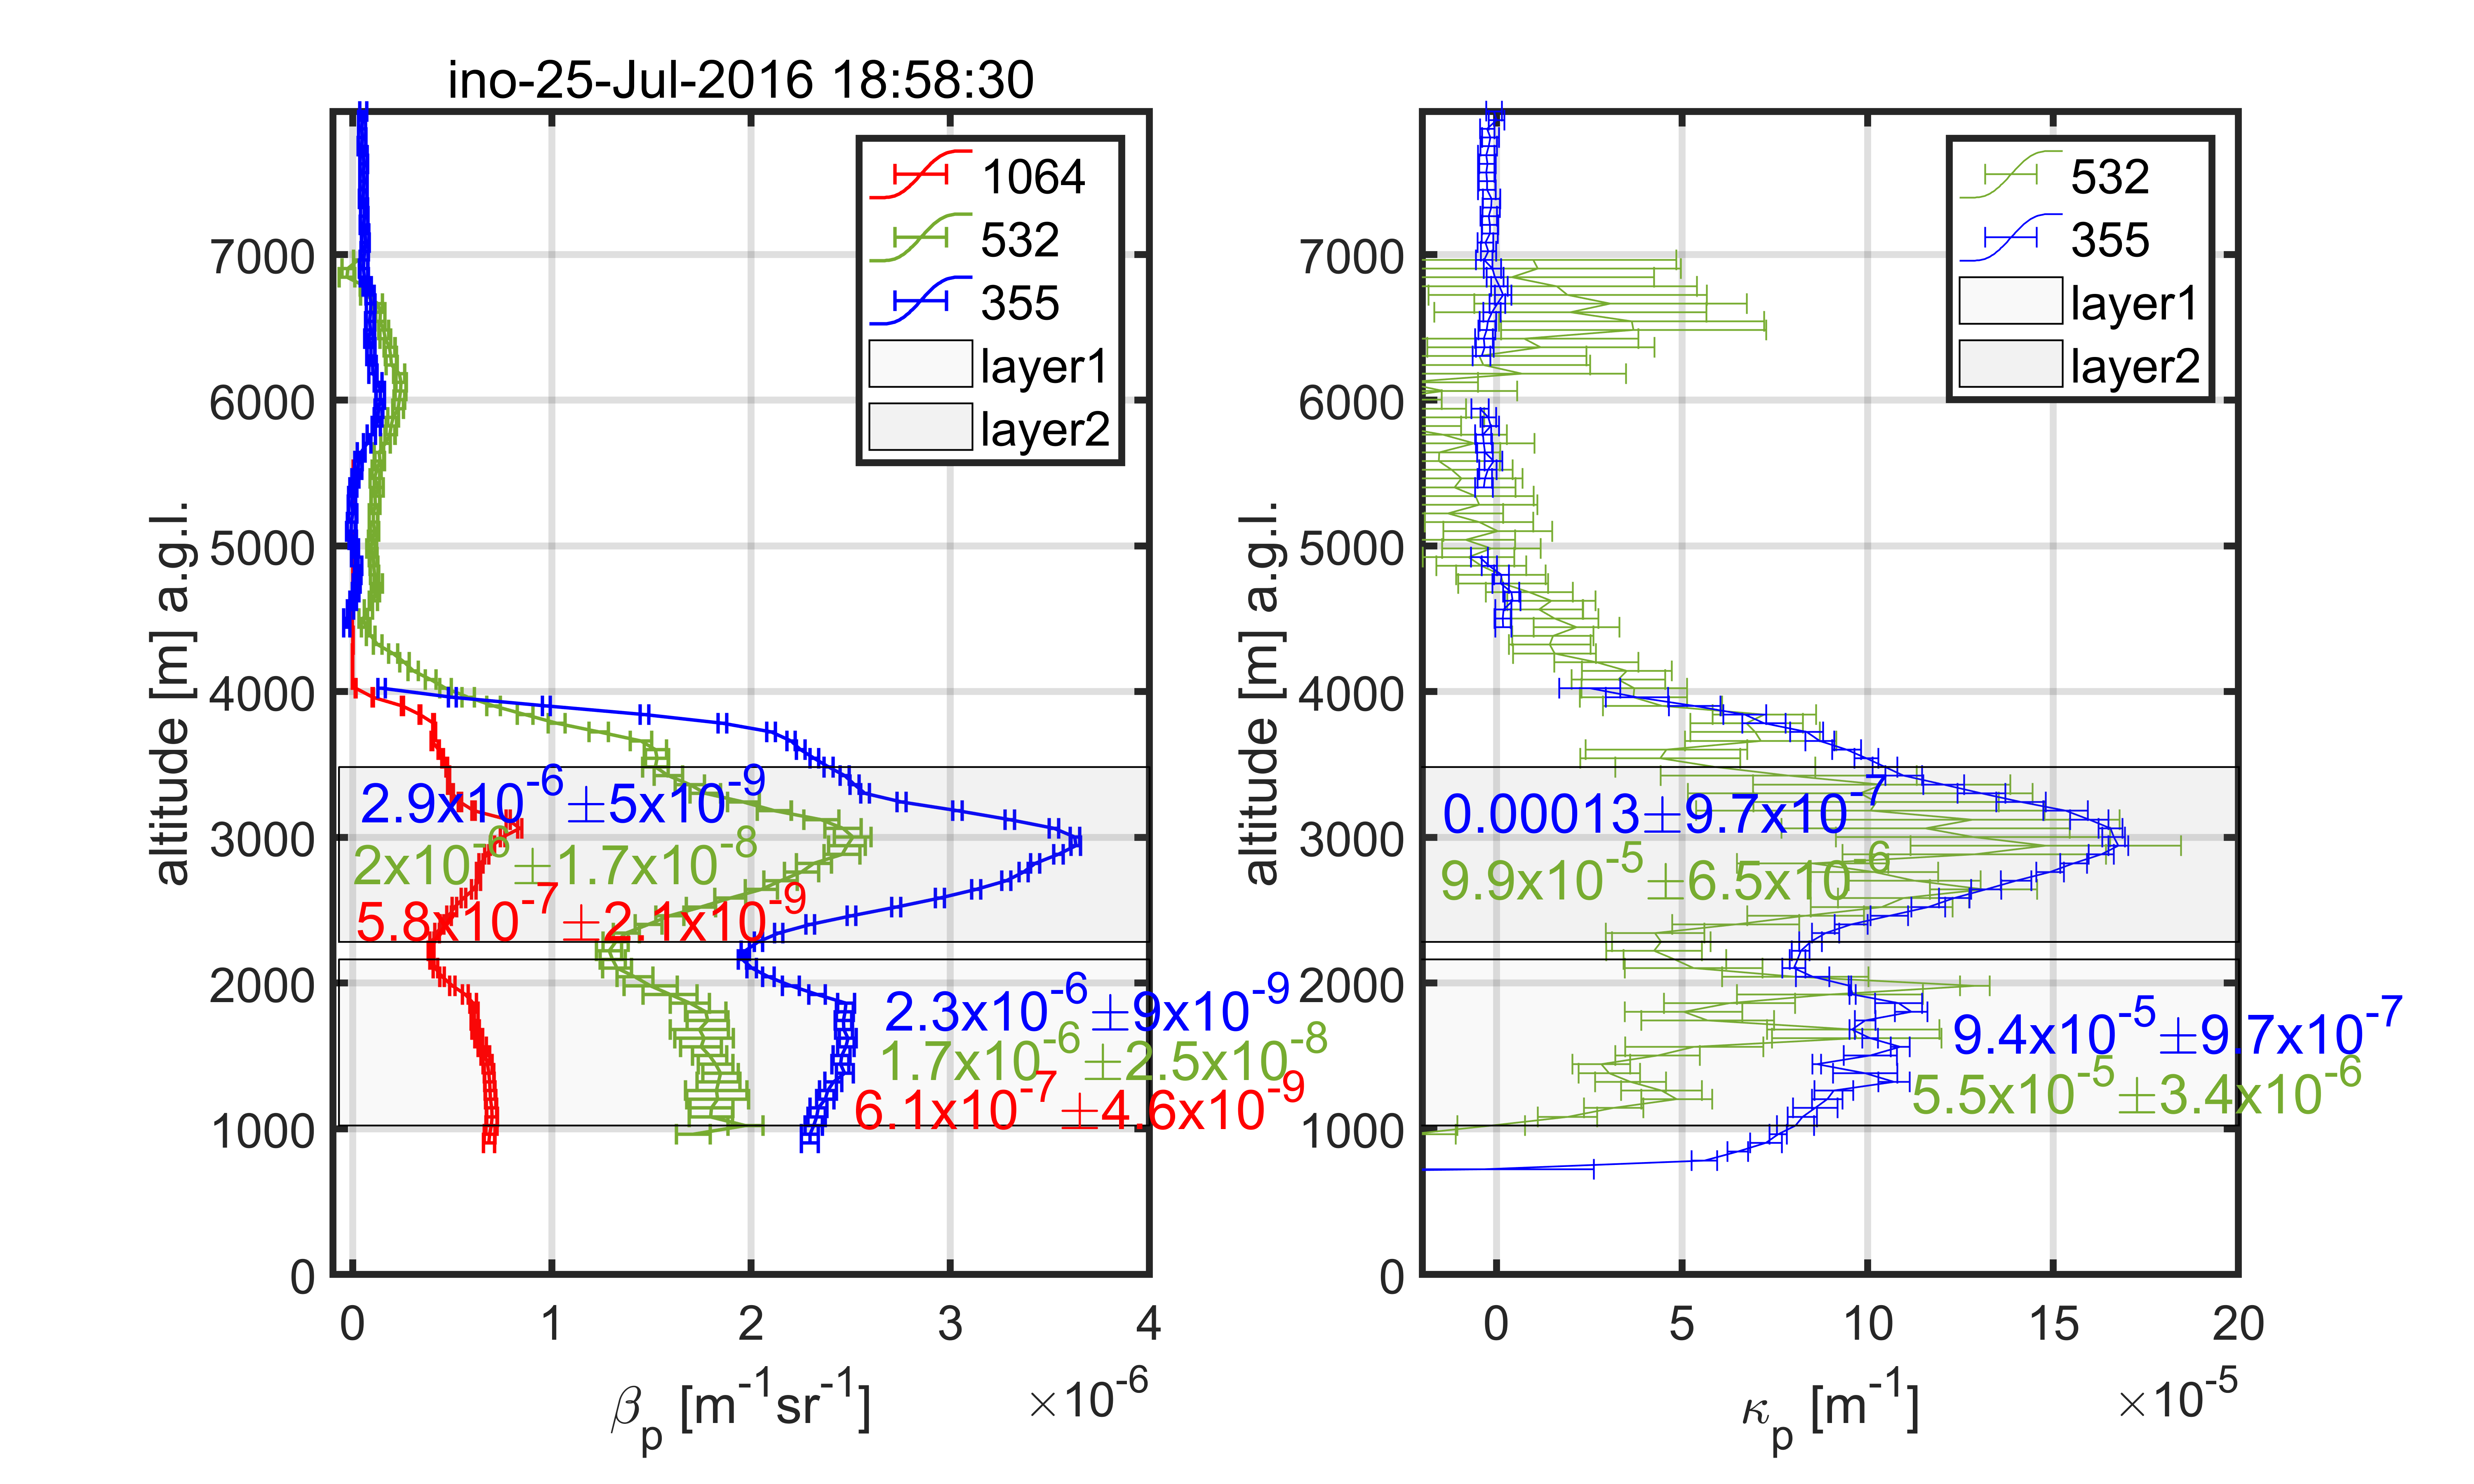
Figure 1. Lidar averaged profiles over ~ 18:30 – 19:30 UTC on 25 July 2016: aerosol backscatter coefficient at 355 nm, 532 nm and 1064 nm (left) and aerosol extinction coefficient at 355 nm and 532 nm (right). The layers are marked (gray shaded) while the mean values of the optical properties in the layer are shown with the corresponding color for each parameter.

Figure 2. Ensemble backtrajectories (blue lines) and the mean trajectory (red) for 25 July 2016 19:00 UTC. The middle plot shows the trajectories altitudes versus time. The brown dots represent the fires’ locations (upper plot) and their injection height (middle plot). The smoke middle layer is at 1500 m a.g.l. The lower plot shows RH for both ensemble and mean trajectories. The location of the fires is shown by bars. Note that the fires colors represent the land cover type (legend upper plot) while their dimensions are set up according to their FRP size in MW (upper plot, x‐label).

Figure 3. (upper) ERA5 reanalysis of mean geopotential height at 850hPa (black contours) during 24 July 2016 00UTC and 25 July 2016 19UTC. The mean trajectory (red) is overlapped and the fires are shown in brown dots (similar with Figure 2). (lower) FLEXPART source‐receptor sensitivity for the lidar measurement on 25 July 2016 19:00 at ~1500m.

Figure 4. Intensive parameters for EPVT=II and EPVT=IV. Lower right plot shows the travel time for both types.
Table 1. The main features for the 11 smoke layers. The fresh smoke is highlighted in light blue and the aged smoke in darker blue.
